
Understanding how people interact with a website, landing page, email, advertisement, or digital product is essential for making better decisions online. 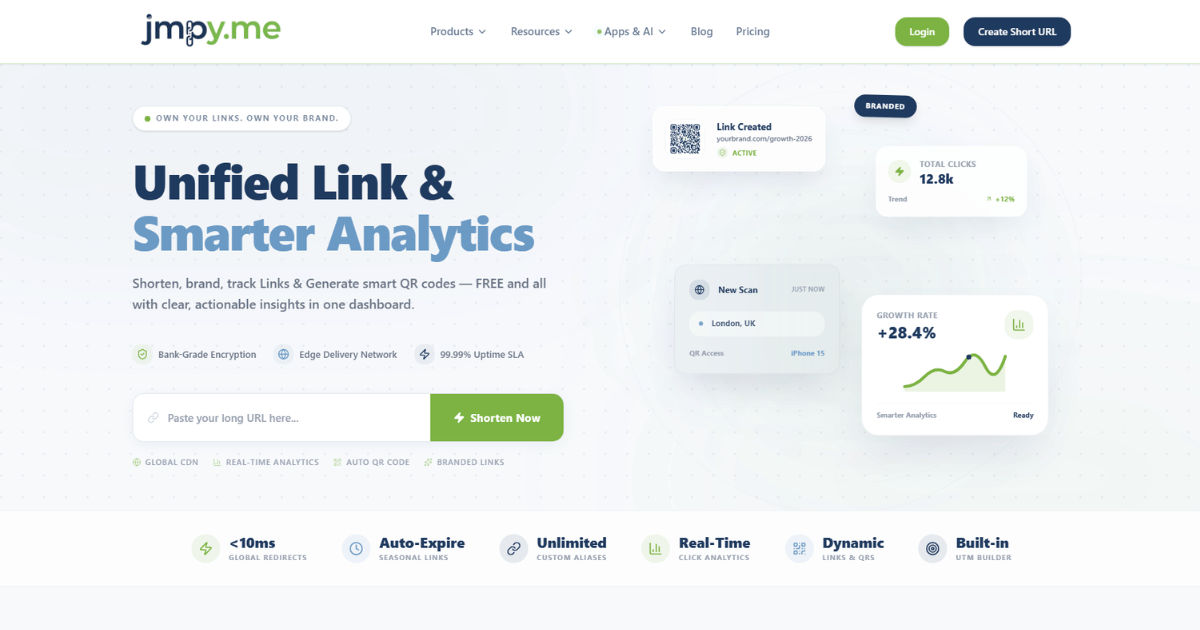 A page may receive thousands of visitors, but that number alone does not explain what those visitors actually do. This is where Click analytics becomes valuable.
Real-time click analytics shows what users are clicking and interacting with as activity happens. Instead of waiting until the end of the day or the next reporting period, you can watch user actions as they occur. This can help you understand which links, buttons, images, menus, advertisements, and other interactive elements are attracting attention.
For businesses, marketers, website owners, and product teams, this information can provide a much clearer picture of user behavior. You can see whether visitors are engaging with an important call-to-action, exploring navigation links, clicking promotional offers, or ignoring elements that were expected to perform well.
Real-time reporting is especially useful when something important is happening right now. For example, if you have just launched a marketing campaign, published a new landing page, sent an email newsletter, or started a limited-time promotion, you may want to know immediately whether users are responding.
However, real-time click data is more than a live counter. When interpreted correctly, it can help identify patterns, detect problems, measure engagement, and guide improvements.
This comprehensive guide explains what real-time click analytics shows, how it works, what information it can reveal, how businesses use it, and what its limitations are.
What Is Real-Time Click Analytics?
Real-time click analytics is the process of monitoring user clicks and interactions as they happen or shortly after they happen.
Traditional analytics often focuses on historical data. You might look at yesterday's visitors, last month's conversion rate, or a campaign's total number of clicks. Real-time analytics focuses on what is happening at the current moment.
For example, imagine you publish a new product page at 10:00 AM. Within the next hour, visitors begin arriving. A real-time analytics system may show that users are clicking the product images, opening the pricing section, selecting different product options, and pressing the "Buy Now" button.
This information can appear on a dashboard where activity is updated continuously or at short intervals.
The exact information available depends on the analytics platform being used. Some systems provide simple click counts, while others provide more detailed information about the location of users, traffic sources, devices, pages, and specific elements being clicked.
The goal is to give you a current view of user behavior.
What Does Real-Time Click Analytics Actually Show?
The most important question is what information you can expect to see.
Real-time click analytics can show several types of user activity. The exact features vary between tools, but most systems focus on identifying where users interact and how frequently those interactions occur.
Click Volume
One of the simplest metrics is the total number of clicks.
This tells you how many times users have clicked a particular element during a selected period. For example, you may discover that a "Get Started" button has received 500 clicks today.
Click volume can help you understand which elements are receiving attention.
However, a high number of clicks does not automatically mean an element is successful. A button may receive many clicks but produce very few completed purchases or registrations.
For this reason, click volume should usually be considered alongside other metrics.
Clicks on Specific Buttons
Real-time analytics can help identify which buttons users are interacting with.
For example, a website might have buttons such as "Contact Us," "Request a Quote," "Download Guide," and "Buy Now."
By tracking these actions, you can determine which calls to action are attracting the most attention.
This can be particularly useful when testing different page layouts or marketing messages.
Link Clicks
Real-time data can show which links visitors are selecting.
These may include navigation links, internal page links, external resources, product links, or links within articles.
If an important link receives very few clicks, it may indicate that visitors are not noticing it, do not understand its purpose, or simply do not find it relevant.
Image Clicks
Some websites use clickable images to direct users toward products, categories, or additional information.
Real-time click tracking can show whether visitors are interacting with those images.
This is useful for online stores, portfolio websites, news websites, and content platforms.
If an image is designed to lead users toward an important page but receives almost no interaction, you may need to reconsider its placement or presentation.
Navigation Clicks
Navigation behavior can reveal how visitors explore a website.
You may discover that users frequently click the "Services" menu but rarely select the "About Us" section.
You might also find that visitors repeatedly use a particular category or search feature.
This information can help website owners understand which areas of the site matter most to their audience.
Call-to-Action Performance
Calls to action are designed to encourage users to take a specific step.
Examples include signing up for a newsletter, requesting information, purchasing a product, booking an appointment, or downloading a resource.
Real-time click analytics can show whether these calls to action are receiving attention.
This is especially useful during campaigns because you can quickly see whether users are responding to the message being presented.
Real-Time Click Analytics Can Show Where Users Are Coming From
Clicks do not happen in isolation.
A good analytics system can often connect clicks with traffic sources.
For example, visitors may arrive from search engines, social media, email campaigns, advertisements, referral websites, or direct visits.
This allows you to compare how different traffic sources behave.
Imagine that a website receives visitors from two advertising campaigns. The first campaign generates 1,000 visitors and 50 clicks on the main offer. The second generates 500 visitors but produces 100 clicks.
The second campaign may be attracting a more engaged audience.
This is why understanding the source behind the clicks can be more useful than looking only at total traffic.
Real-time information can help marketers quickly determine whether a newly launched campaign is generating meaningful engagement.
It Can Show What Users Click on During a Live Campaign
One of the strongest advantages of real-time analytics is speed.
Suppose a company launches a promotional campaign at noon.
Within minutes, the marketing team can begin observing user interactions.
They may discover that visitors are clicking the promotional banner but not the checkout button.
This could indicate a problem in the customer journey.
Perhaps the promotion is attractive, but the next page is confusing. Maybe the pricing information is unclear. Perhaps the checkout button is difficult to find.
Without real-time information, the team might not discover the problem until much later.
With live data, they can investigate while the campaign is still running.
It Can Help Identify Popular Content
Real-time click data can also reveal which content is receiving attention.
For example, a news website may publish several articles in one day.
One article might receive a large number of clicks immediately after publication, while others receive little attention.
This information can help editors understand what topics are attracting readers.
Similarly, a business blog can use live engagement data to identify which articles, guides, or resources are generating the most interest.
This does not mean every popular piece of content is automatically valuable. However, it provides useful evidence about what audiences are currently interested in.
It Can Show User Behavior Across Different Devices
People interact with websites differently depending on the device they use.
A desktop visitor may have a large screen and easy access to navigation menus.
A mobile visitor may be using a smaller screen and relying heavily on buttons and touch interactions.
Real-time click analytics can sometimes break down activity by device type.
You might discover that desktop users are clicking a particular feature frequently while mobile users are not.
This could indicate a mobile usability problem.
For example, a button may appear clearly on desktop but become difficult to find on a smartphone.
If mobile users are visiting a page but rarely clicking the primary action, the design may need to be reviewed.
It Can Reveal Geographic Activity
Some analytics systems provide geographic information about users.
This can show where visitors are located at a broad regional or country level.
For businesses operating in multiple markets, this information can be useful.
For example, a company may launch a campaign aimed at customers in several countries. Real-time reporting can help the team observe where engagement is coming from.
This can also be useful for time-sensitive campaigns.
If users in one region are actively engaging while another region shows little activity, marketers may investigate differences in timing, messaging, language, or audience targeting.
Geographic information should always be interpreted carefully because location data may not always be perfectly accurate.
It Can Show When Users Are Most Active
Real-time analytics can help identify periods of high activity.
You may notice that clicks increase during certain hours of the day.
For example, an online service may receive the most engagement between 6 PM and 10 PM.
A business could use this information to plan campaign launches, promotional announcements, or content publishing schedules.
However, one day of activity is rarely enough to establish a reliable pattern.
It is better to observe activity over multiple days or weeks before making major decisions.
It Can Show Engagement With Landing Pages
Landing pages are often designed around one primary goal.
That goal could be generating leads, selling a product, collecting registrations, or encouraging downloads.
Real-time click analytics can help determine whether visitors are interacting with the important elements of the page.
For example, visitors may click the headline, read the page, and then leave without clicking the main call-to-action.
This suggests that traffic is arriving, but the page may not be convincing users to take the next step.
On the other hand, a high number of clicks on the primary action can indicate strong initial engagement.
Again, clicks alone do not prove success. The next step is to determine whether those clicks lead to the desired outcome.
It Can Help Detect Technical Problems
Real-time click data can sometimes reveal technical issues quickly.
Imagine that a website receives normal traffic, but clicks on an important button suddenly drop to zero.
This could be caused by a broken link, a JavaScript error, a design change, or another technical problem.
The analytics data itself may not explain the exact cause, but the sudden change can act as an early warning sign.
For this reason, monitoring live user activity can be valuable after launching website updates.
A team can compare normal behavior with activity immediately after a change.
If users suddenly stop interacting with an important feature, developers can investigate.
It Can Show Unexpected User Behavior
One of the most useful aspects of real-time data is that it can reveal behavior you did not anticipate.
A website owner may believe that visitors will click one button first.
Instead, users may repeatedly click another element.
For example, visitors may ignore the primary navigation and use a search function instead.
Or they may click product images much more frequently than product titles.
These observations can challenge assumptions about how people use a website.
The best analytics work often begins when actual behavior contradicts expectations.
How Real-Time Click Analytics Is Collected
Behind the scenes, click tracking usually relies on analytics software installed on a website, application, email system, or digital platform.
When a user interacts with a tracked element, the system records an event.
The event may contain information such as the type of interaction, the page where it occurred, the element involved, and the approximate time.
The data is then sent to an analytics system for processing.
Depending on the platform, the information may appear almost immediately or after a short delay.
Modern analytics systems often use event-based tracking.
Instead of simply recording that someone visited a page, they can record specific actions such as clicking a button, opening a menu, playing a video, or submitting a form.
This creates a more detailed picture of user behavior.
The Difference Between Real-Time and Historical Analytics
Real-time analytics and historical analytics serve different purposes.
Real-time data helps you understand what is happening now.
Historical data helps you understand what has happened over time.
Suppose you are running an advertising campaign.
Real-time reporting may tell you that people are clicking your advertisement today.
Historical reporting can tell you how the campaign performed over the past month.
Both are important.
Real-time information is useful for immediate decisions and troubleshooting.
Historical information is better for identifying long-term patterns, seasonal trends, and performance changes.
A strong analytics strategy usually combines both.
Why Clicks Alone Are Not Enough
A common mistake is to treat clicks as the final measure of success.
They are not.
A click represents an interaction, but it does not necessarily represent a completed goal.
For example, someone might click a "Buy Now" button but abandon the checkout process.
Someone might click a newsletter subscription button but never complete the form.
Someone might click an advertisement accidentally.
Therefore, click data should be connected to meaningful outcomes.
These outcomes could include purchases, registrations, downloads, leads, or completed forms.
The real question is not simply, "How many people clicked?"
It is also, "What happened after they clicked?"
Click-Through Rate and Real-Time Performance
Click-through rate, often called CTR, measures the percentage of users who click after seeing an element.
For example, if 1,000 people see an advertisement and 50 click it, the click-through rate is 5%.
Real-time reporting can help marketers observe how CTR changes during a campaign.
However, early data may be unstable.
If only a small number of people have seen the advertisement, a few clicks can cause the percentage to change dramatically.
For this reason, real-time performance should be treated as an early indicator rather than a final conclusion.
How Businesses Use Real-Time Click Data
Different businesses use real-time analytics in different ways.
An online store may monitor clicks on products and promotional offers.
A media company may watch which articles are attracting readers.
A software company may monitor interactions with new features.
A marketing agency may observe campaign engagement.
A service business may track clicks on contact and booking buttons.
The common purpose is to understand user behavior and respond when necessary.
The value comes from turning observations into practical decisions.
Using Real-Time Data to Improve Website Design
Website design should be based on how users actually behave, not only on what designers expect.
If users consistently click a certain element, that may indicate that it is important to them.
If users ignore a major feature, the design may need to make its purpose clearer.
For example, a website may have an important "Request a Quote" button buried below several sections.
If analytics shows that few visitors reach or interact with it, the business might move the button higher on the page.
The goal is not to manipulate users.
The goal is to make useful actions easier to find.
Using Real-Time Data During A/B Testing
A/B testing compares two versions of a page or element.
For example, one version may use one button label while another uses a different label.
Real-time analytics can help teams monitor early interactions with both versions.
However, teams should avoid making decisions too quickly.
A small sample can produce misleading results.
A version that appears better after the first hour may perform worse after several days.
Real-time data is useful for monitoring, but statistically reliable conclusions usually require enough data and an appropriate testing period.
Common Mistakes When Interpreting Real-Time Click Data
One major mistake is reacting to every small change.
Click activity naturally rises and falls.
A temporary increase does not always represent a meaningful trend.
Another mistake is focusing only on the highest number.
A page with the most clicks may not generate the most revenue or leads.
A third mistake is ignoring context.
A campaign may receive fewer clicks because it targets a smaller but more valuable audience.
The quality of traffic matters.
Finally, businesses sometimes collect large amounts of data without deciding what they actually want to learn.
Analytics is most useful when it answers a specific question.
Privacy and Responsible Tracking
User tracking should be handled responsibly.
Organizations should understand applicable privacy laws and regulations and provide appropriate disclosures where required.
Not every piece of user information should be collected simply because it can be collected.
Businesses should focus on gathering information that serves a legitimate purpose.
They should also protect collected data and limit access appropriately.
Responsible analytics is not only about compliance. It also helps build trust with users.
What Real-Time Click Analytics Cannot Tell You
Real-time data is powerful, but it has limits.
A click can tell you that an interaction happened.
It usually cannot tell you exactly why the user clicked.
For example, a person may click a button because they are interested, confused, curious, or accidentally touched it.
Analytics records behavior, not personal thoughts.
To understand motivations, businesses may need other methods, such as surveys, interviews, usability testing, customer feedback, or session analysis.
Combining quantitative data with qualitative feedback often produces a much clearer understanding of user behavior.
How to Make Better Decisions From Click Data
The best approach is to start with a question.
Instead of asking, "What does the dashboard show?" ask something more specific.
For example:
"Are visitors noticing the new offer?"
"Are mobile users interacting with the checkout button?"
"Which campaign is generating the strongest engagement?"
"Are users reaching the contact form?"
Specific questions make analytics easier to interpret.
Next, compare the click data with outcomes.
If clicks increase but conversions remain unchanged, the problem may exist after the click.
If clicks are low, the problem may be with visibility, messaging, relevance, or audience targeting.
The data becomes useful when it helps explain what should happen next.
The Future of Real-Time Click Analytics
Analytics is becoming increasingly sophisticated.
Modern systems can combine event tracking, user journeys, conversion data, automated alerts, and predictive analysis.
Instead of simply showing that a user clicked a button, future systems can provide more context around the complete journey.
Artificial intelligence can also help identify unusual patterns and highlight changes that humans might miss.
For example, an analytics system could detect that clicks on a critical feature have suddenly declined compared with normal behavior.
This could allow teams to investigate problems faster.
However, more advanced technology does not remove the need for human judgment.
Data still needs context.
A sudden change may be caused by a technical problem, a marketing campaign, a holiday, a news event, or a change in customer behavior.
The technology can identify the pattern, but people still need to determine what it means.
Practical Example of Real-Time Click Analytics
Imagine an online clothing store launches a weekend sale.
The marketing team sends an email to 20,000 subscribers.
Within the first hour, the analytics dashboard shows that many people are clicking the sale banner.
However, only a small percentage are clicking individual products.
The team investigates and discovers that the sale banner leads to a category page with too many products and no clear sorting options.
The team improves the page by adding filters and clearer product categories.
After the change, product clicks increase.
This example demonstrates how real-time data can help identify an issue while a campaign is still active.
The analytics did not solve the problem automatically.
It simply provided evidence that helped the team investigate the customer journey.
Best Practices for Using Real-Time Click Analytics
Start by defining clear goals.
Decide what actions matter most to your business.
Track important interactions rather than collecting unnecessary information.
Use consistent event names and tracking methods.
Compare clicks with conversions and other meaningful outcomes.
Segment data by useful factors such as traffic source or device when appropriate.
Avoid making major decisions from extremely small data samples.
Look for patterns rather than reacting to every individual change.
Combine analytics with customer feedback when possible.
Review tracking regularly to ensure that important events are still being recorded correctly.
Most importantly, treat analytics as a decision-support tool.
The purpose is not to collect the largest amount of data.
The purpose is to understand users better and improve their experience.
Conclusion
Real-time click analytics provides a live or near-live view of how users interact with digital experiences.
It can show which buttons people click, which links attract attention, which content receives engagement, and how visitors move through important parts of a website or application.
It can also provide useful context about traffic sources, devices, geographic regions, and activity patterns, depending on the analytics platform.
The biggest advantage is speed.When a campaign is running, a new page is launched, or a website update goes live, real-time information allows teams to observe behavior without waiting for a long reporting cycle.
This can help businesses identify problems earlier, recognize successful content, and respond to unexpected behavior.
However, clicks should never be viewed as the complete story.A high click count does not automatically mean a successful campaign. A low click count does not always mean failure. The real value comes from understanding what happens after the interaction.